Download data from Connectivity Map project site
The drug-related expression data are downloaded from the CMAP web site
here. The getCmap function downloads
the CMAP rank matrix along with the compound annotations, and getCmapCEL
downloads the corresponding 7,056 CEL files. The functions will write the
downloaded files to the data and data/CEL directories within the present
working directory of the user’s R session. Since some of the raw data sets
are large, the functions will only rerun the download if the argument rerun
is assigned TRUE. If the raw data are not needed then users can skip this
time consuming download step and work with the preprocessed data
obtained in the next section.
getCmap(rerun=FALSE) # Downloads cmap rank matrix and compound annotation files
getCmapCEL(rerun=FALSE) # Download cmap CEL files. Note, this will take some time
Overview of CMAP data
The experimental design of the CMAP project is defined in the file
cmap_instances_02.xls. Note, this file required some cleaning in LibreOffice
(Excel would work for this too). After this it was saved as tab delimited txt
file named
cmap_instances_02.txt.
The following count statisitics are extracted from this file.
The panel of cell lines used by CMAP includes
MCF7,
ssMCF7,
HL60,
PC3 and
SKMEL5.
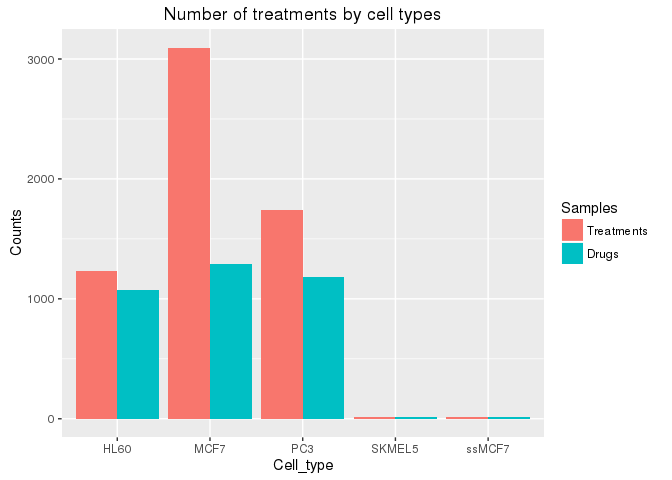
Each cell type was subjected to the following number of total treatments and number
of distinct drugs, respectively. The total number of drugs used by CMAP is 1,309.
library(ggplot2); library(reshape2)
cmap <- read.delim("./data/cmap_instances_02.txt", check.names=FALSE)
df <- data.frame(table(cmap[, "cell2"]), as.numeric(table(cmap[!duplicated(paste0(cmap$cmap_name, cmap$cell2)),"cell2"])))
colnames(df) <- c("Cell_type", "Treatments", "Drugs")
df <- melt(df, id.vars=c("Cell_type"), variable.name = "Samples", value.name="Counts")
ggplot(df, aes(Cell_type, Counts, fill=Samples)) +
       geom_bar(position="dodge", stat="identity") +
       ggtitle("Number of treatments by cell types")

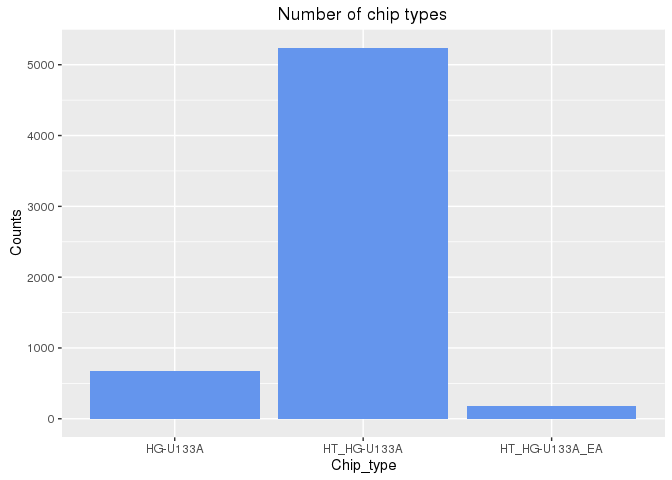
The number Affymetrix chip used in the experiments is plotted here for each of
the three chip types used by CMAP:
df <- data.frame(table(cmap$array3)); colnames(df) <- c("Chip_type", "Counts")
ggplot(df, aes(Chip_type, Counts)) +
       geom_bar(position="dodge", stat="identity", fill="cornflowerblue") +
       ggtitle("Number of chip types")
