Experiment definition provided by targets file
The targets file defines all FASTQ files and sample comparisons of the analysis workflow.
targetspath <- system.file("extdata", "targetsPE.txt", package="systemPipeR")
targets <- read.delim(targetspath, comment.char = "#")
targets[,-c(5,6)]
##                   FileName1                FileName2 SampleName Factor        Date
## 1  ./data/SRR446027_1.fastq ./data/SRR446027_2.fastq        M1A     M1 23-Mar-2012
## 2  ./data/SRR446028_1.fastq ./data/SRR446028_2.fastq        M1B     M1 23-Mar-2012
## 3  ./data/SRR446029_1.fastq ./data/SRR446029_2.fastq        A1A     A1 23-Mar-2012
## 4  ./data/SRR446030_1.fastq ./data/SRR446030_2.fastq        A1B     A1 23-Mar-2012
## 5  ./data/SRR446031_1.fastq ./data/SRR446031_2.fastq        V1A     V1 23-Mar-2012
## 6  ./data/SRR446032_1.fastq ./data/SRR446032_2.fastq        V1B     V1 23-Mar-2012
## 7  ./data/SRR446033_1.fastq ./data/SRR446033_2.fastq        M6A     M6 23-Mar-2012
## 8  ./data/SRR446034_1.fastq ./data/SRR446034_2.fastq        M6B     M6 23-Mar-2012
## 9  ./data/SRR446035_1.fastq ./data/SRR446035_2.fastq        A6A     A6 23-Mar-2012
## 10 ./data/SRR446036_1.fastq ./data/SRR446036_2.fastq        A6B     A6 23-Mar-2012
## 11 ./data/SRR446037_1.fastq ./data/SRR446037_2.fastq        V6A     V6 23-Mar-2012
## 12 ./data/SRR446038_1.fastq ./data/SRR446038_2.fastq        V6B     V6 23-Mar-2012
## 13 ./data/SRR446039_1.fastq ./data/SRR446039_2.fastq       M12A    M12 23-Mar-2012
## 14 ./data/SRR446040_1.fastq ./data/SRR446040_2.fastq       M12B    M12 23-Mar-2012
## 15 ./data/SRR446041_1.fastq ./data/SRR446041_2.fastq       A12A    A12 23-Mar-2012
## 16 ./data/SRR446042_1.fastq ./data/SRR446042_2.fastq       A12B    A12 23-Mar-2012
## 17 ./data/SRR446043_1.fastq ./data/SRR446043_2.fastq       V12A    V12 23-Mar-2012
## 18 ./data/SRR446044_1.fastq ./data/SRR446044_2.fastq       V12B    V12 23-Mar-2012
Read quality filtering and trimming
The following removes reads with low quality base calls (here Phred scores below 20) from all FASTQ files.
args <- systemArgs(sysma="param/trimPE.param", mytargets="targetsPE.txt")[1:4] # Note: subsetting!
filterFct <- function(fq, cutoff=20, Nexceptions=0) {
    qcount <- rowSums(as(quality(fq), "matrix") <= cutoff)
    fq[qcount <= Nexceptions] # Retains reads where Phred scores are >= cutoff with N exceptions
}
preprocessReads(args=args, Fct="filterFct(fq, cutoff=20, Nexceptions=0)", batchsize=100000)
writeTargetsout(x=args, file="targets_PEtrim.txt", overwrite=TRUE)
FASTQ quality report
The following seeFastq and seeFastqPlot functions generate and plot a series of
useful quality statistics for a set of FASTQ files including per cycle quality box
plots, base proportions, base-level quality trends, relative k-mer
diversity, length and occurrence distribution of reads, number of reads
above quality cutoffs and mean quality distribution. The results are
written to a PDF file named fastqReport.pdf.
args <- systemArgs(sysma="param/tophat.param", mytargets="targets.txt")
fqlist <- seeFastq(fastq=infile1(args), batchsize=100000, klength=8)
pdf("./results/fastqReport.pdf", height=18, width=4*length(fqlist))
seeFastqPlot(fqlist)
dev.off()
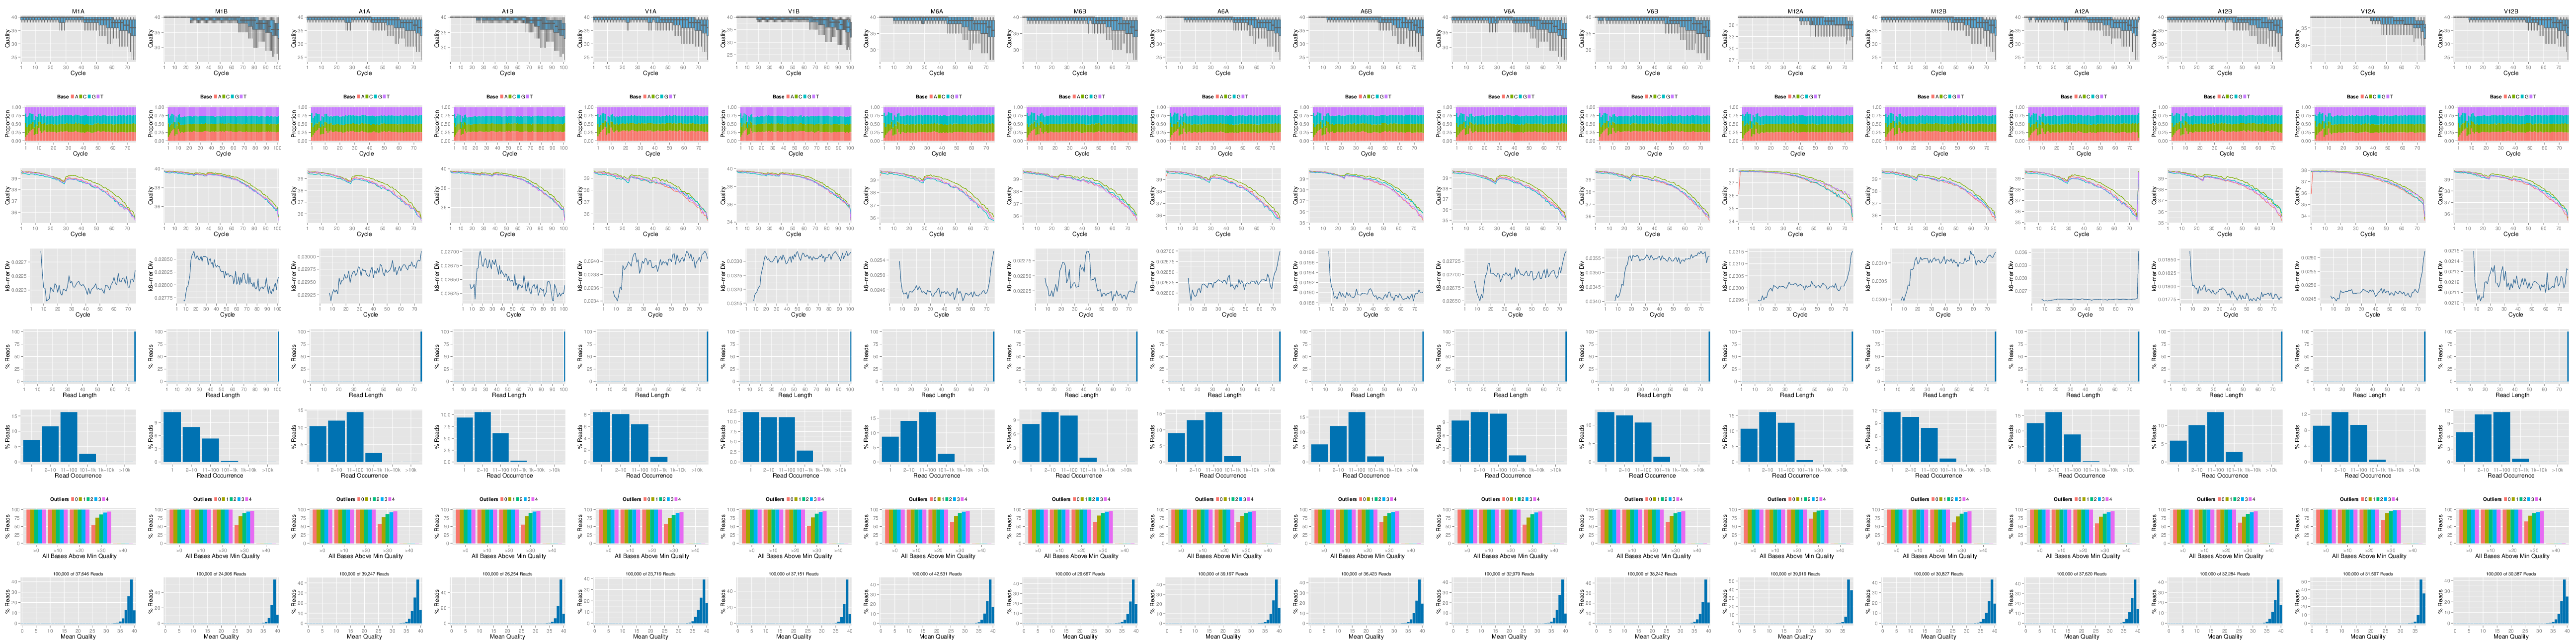
Figure 1: FASTQ quality report for 18 samples