Experiment definition provided by targets file
The targets file defines all FASTQ files and sample comparisons of the analysis workflow.
targetspath <- system.file("extdata", "targets_chip.txt", package="systemPipeR")
targets <- read.delim(targetspath, comment.char = "#")
targets[1:4,-c(5,6)]
##                   FileName SampleName Factor SampleLong SampleReference
## 1 ./data/SRR446027_1.fastq        M1A     M1  Mock.1h.A
## 2 ./data/SRR446028_1.fastq        M1B     M1  Mock.1h.B
## 3 ./data/SRR446029_1.fastq        A1A     A1   Avr.1h.A             M1A
## 4 ./data/SRR446030_1.fastq        A1B     A1   Avr.1h.B             M1B
Read quality filtering and trimming
The following example shows how one can design a custom read
preprocessing function using utilities provided by the ShortRead package, and then
apply it with preprocessReads in batch mode to all FASTQ samples referenced in the
corresponding SYSargs instance (args object below). More detailed information on
read preprocessing is provided in systemPipeR's main vignette.
args <- systemArgs(sysma="param/trim.param", mytargets="targets_chip.txt")
filterFct <- function(fq, cutoff=20, Nexceptions=0) {
    qcount <- rowSums(as(quality(fq), "matrix") <= cutoff)
    fq[qcount <= Nexceptions] # Retains reads where Phred scores are >= cutoff with N exceptions
}
preprocessReads(args=args, Fct="filterFct(fq, cutoff=20, Nexceptions=0)", batchsize=100000)
writeTargetsout(x=args, file="targets_chip_trim.txt", overwrite=TRUE)
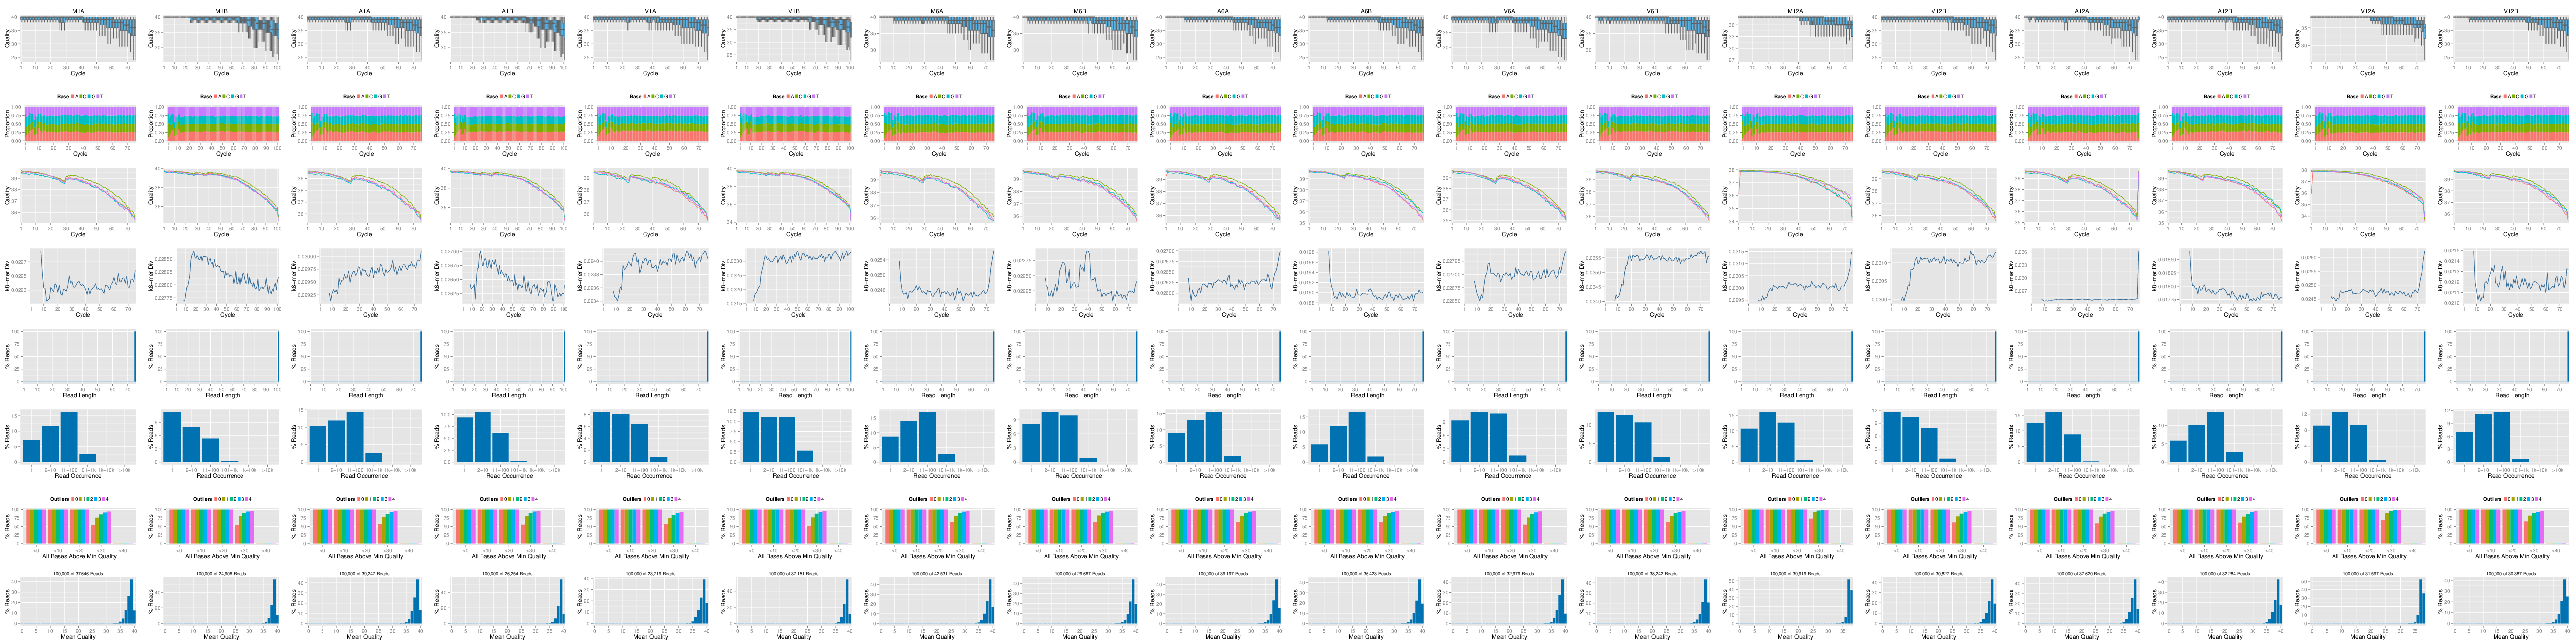
FASTQ quality report
The following seeFastq and seeFastqPlot functions generate and plot a series of useful quality
statistics for a set of FASTQ files including per cycle quality box
plots, base proportions, base-level quality trends, relative k-mer
diversity, length and occurrence distribution of reads, number of reads
above quality cutoffs and mean quality distribution. The results are
written to a PDF file named fastqReport.pdf.
args <- systemArgs(sysma="param/tophat.param", mytargets="targets_chip.txt")
library(BiocParallel); library(BatchJobs)
f <- function(x) {
    library(systemPipeR)
    args <- systemArgs(sysma="param/tophat.param", mytargets="targets_chip.txt")
    seeFastq(fastq=infile1(args)[x], batchsize=100000, klength=8)
}
funs <- makeClusterFunctionsSLURM("slurm.tmpl")
param <- BatchJobsParam(length(args), resources=list(walltime="00:20:00", ntasks=1, ncpus=1, memory="2G"), cluster.functions=funs)
register(param)
fqlist <- bplapply(seq(along=args), f)
pdf("./results/fastqReport.pdf", height=18, width=4*length(fqlist))
seeFastqPlot(unlist(fqlist, recursive=FALSE))
dev.off()