Research Page
To navigate this site, please click the ☰ symbol to the left.
Summary
The Girke lab focuses on fundamental research questions at the intersection of genome biology and chemical genomics. These include: Which factors in genomes, proteomes and metabolomes are functionally relevant and perturbable by small molecules? What properties of small molecules and their targets are the main drivers for compound-target interactions? How can these insights be used to develop precision perturbation strategies for biological processes with translational applications in both agriculture and human health? To address these questions, the group develops computational methods for analyzing both large-scale omics and small molecule bioactivity data. This includes discovery-oriented projects, as well as algorithm and software development projects for data types from a variety of Big Data technologies, such as NGS, genome-wide profiling approaches and chemical genomics. As part of the multidisciplinary nature of my field, the group frequently collaborates with experimental scientists on data analysis projects of complex biological problems. Another important activity is the development of integrated data analysis systems for the open source software projects R and Bioconductor. The following gives a short summary of a few selected projects.
Selected Projects
Table of Content
- signatureSearch
- spatialHeatmap
- Longevity
- Workflow Software
- Assembly of NGS Data
- Gene Expression Networks
- Cheminformatics Software
- Protein Function
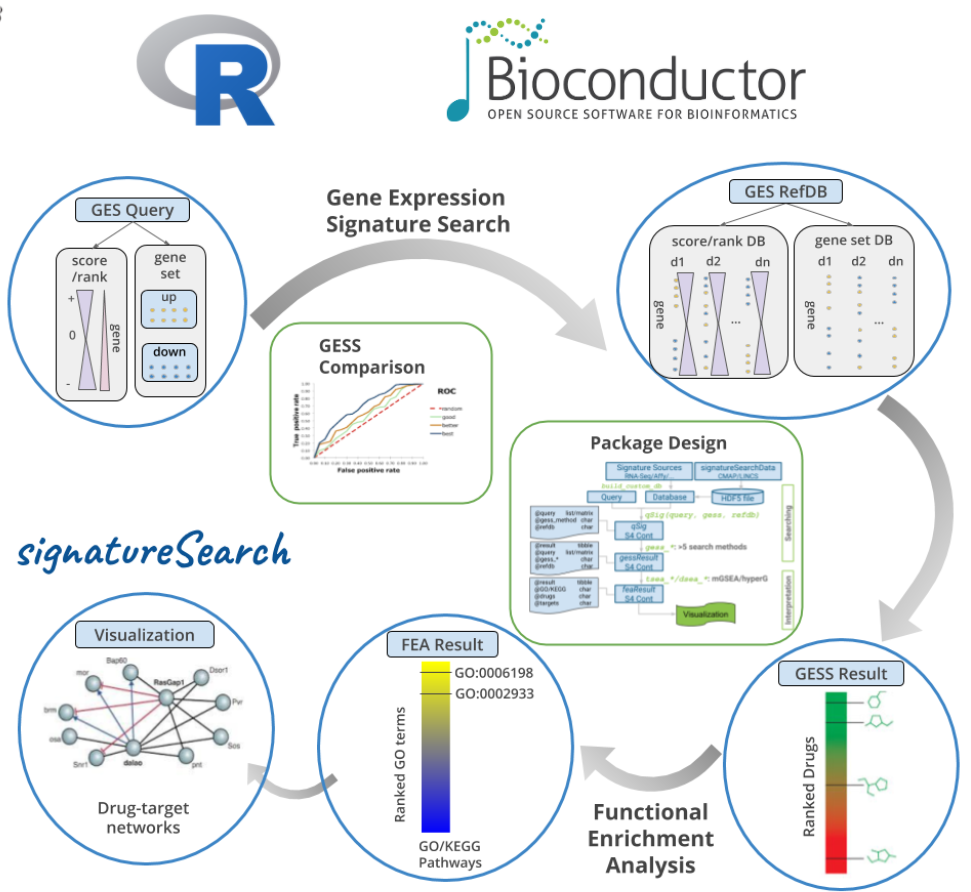
1. Gene Expression Searching with signatureSearch
signatureSearch is an R/Bioconductor package that integrates a suite of existing and novel algorithms into an analysis environment for gene expression signature (GES) searching combined with functional enrichment analysis (FEA) and visualization methods to facilitate the interpretation of the search results (Duan et al., 2020). In a typical GES search (GESS), a query GES is searched against a database of GESs obtained from large numbers of measurements, such as different genetic backgrounds, disease states and drug perturbations. Database matches sharing correlated signatures with the query indicate related cellular responses frequently governed by connected mechanisms, such as drugs mimicking the expression responses of a disease. To identify which processes are predominantly modulated in the GESS results, we developed specialized FEA methods combined with drug-target network visualization tools. The provided analysis tools are useful for studying the effects of genetic, chemical and environmental perturbations on biological systems, as well as searching single cell GES databases to identify novel network connections or cell types. The signatureSearch software is unique in that it provides access to an integrated environment for GESS/FEA routines that includes several novel search and enrichment methods, efficient data structures, and access to pre-built GES databases, and allowing users to work with custom databases.
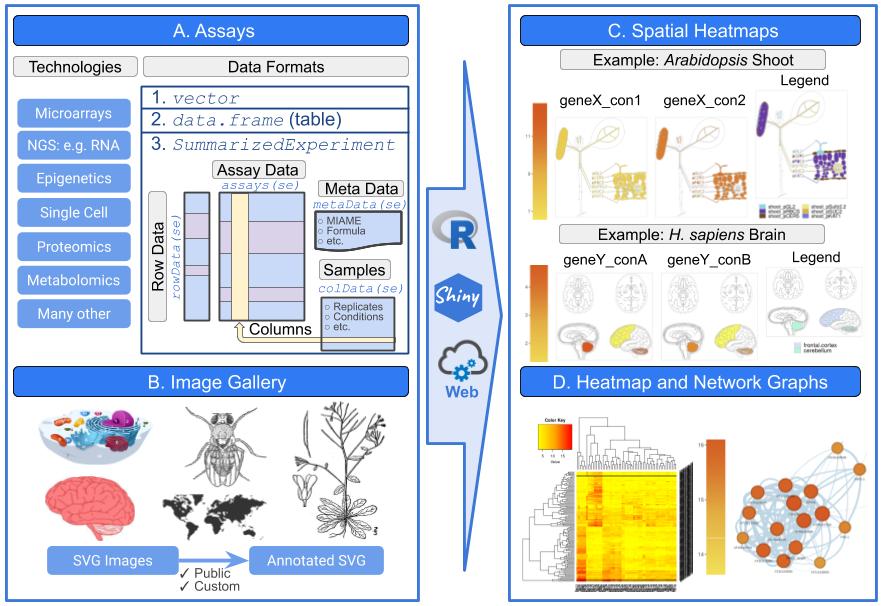
2. Visualizing Spatial Assays in Anatomical Images
The spatialHeatmap package provides functionalities for visualizing cell-, tissue- and organ-specific data of biological assays by coloring the corresponding spatial features defined in anatomical images according to a numeric color key. The color scheme used to represent the assay values can be customized by the user. This core functionality of the package is called a spatial heatmap (SHM) plot. It is enhanced with visualization tools for groups of measured items (e.g. gene modules) sharing related abundance profiles, including matrix heatmaps combined with hierarchical clustering dendrograms and network representations. The functionalities of spatialHeatmap can be used either in a command-driven mode from within R or a graphical user interface (GUI) provided by a Shiny App that is also part of this package. While the R-based mode provides flexibility to customize and automate analysis routines, the Shiny App includes a variety of convenience features that will appeal to experimentalists and other users less familiar with R. Moreover, the Shiny App can be used on both local computers as well as centralized server-based deployments (e.g. cloud-based or custom servers) that can be accessed remotely as a public web service for using spatialHeatmap’s functionalities with community and/or private data. The functionalities of the spatialHeatmap package are illustrated in Figure 2.
3. Projects Related to Longevity and Healthy Aging
Human longevity is heritable, and statistically and biologically compelling genetic associations with longevity and age-related traits have been identified. The translation of these genetic associations into insights that can lead to pharmacological interventions designed to promote healthy aging requires an approach and infrastructure that integrates many genomic resources.
3.1 Longevity Genomics
To address this challenge, the Longevity Genomics research group has been established, an NIA funded research project to develop an integrative genomic resource and infrastructure to develop translational strategies to promote human longevity. The infrastructure will include data from longitudinal cohort studies with genome-wide genotype and sequence data, computational methods for annotating genetic variants, information from tissue-specific expression quantitative trait locus (eQTL) studies, and datasets of chemical properties and protein targets of small molecule compounds.
3.2 Longevity Consortium
The Longevity Consortium (LC) aims to integrate analyses of the genomic, proteomic, and metabolomic bases of human longevity and the lifespans of animal species into models of the molecular pathways that contribute to human longevity. An important goal is to identify pathways that are amenable to pharmacologic intervention. The Girke group is leading the drug-discovery aspects for the LC.
4. Workflow Environment for Large-scale Data Analysis
4.1 systemPipeR: NGS workflow and report generation environment
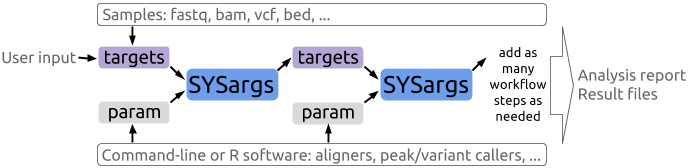
systemPipeR is an R/Bioconductor package for building and running automated analysis workflows for a wide range of next generation sequence (NGS) applications. Important features include a uniform workflow interface across different NGS applications, automated report generation, and support for running both R and command-line software, such as NGS aligners or peak/variant callers, on local computers or compute clusters. Efficient handling of complex sample sets and experimental designs is facilitated by a consistently implemented sample annotation infrastructure.
4.2 Shiny App for systemPipeR workflows
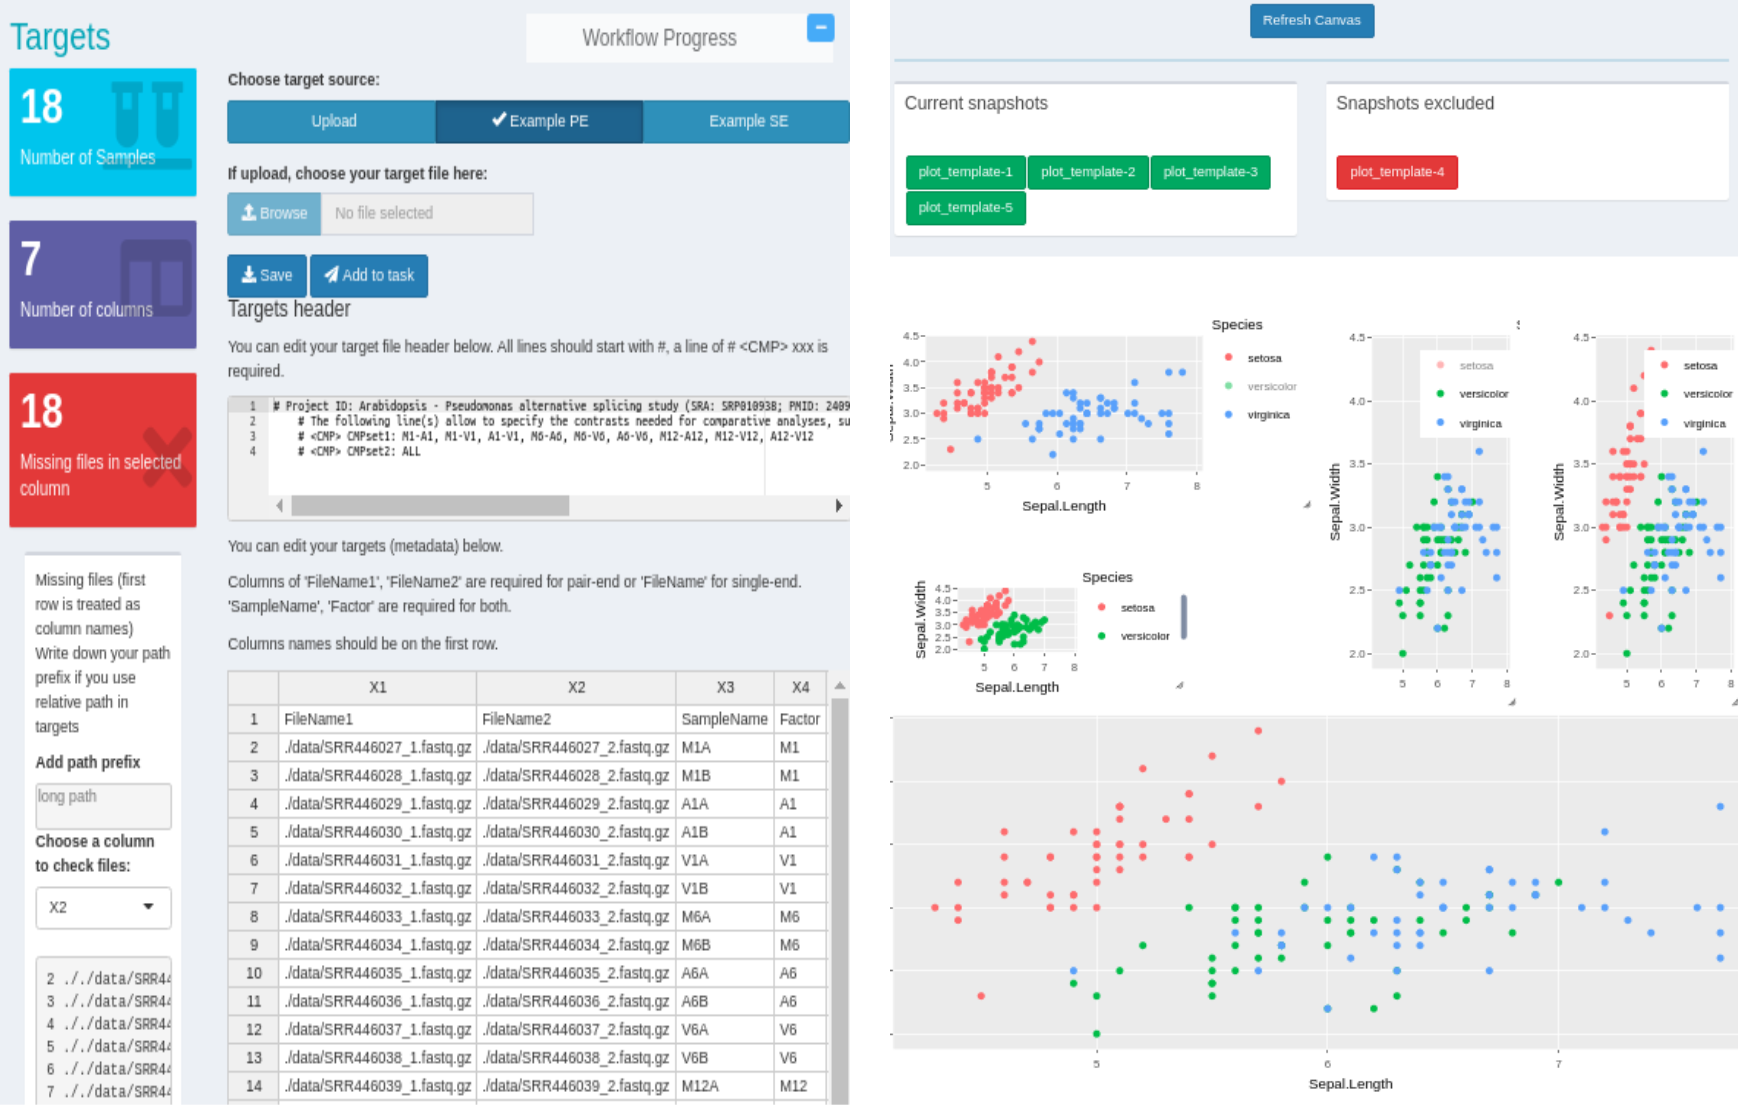
The systemPipeShiny (SPS) extends the widely used systemPipeR (SPR) workflow environment with a versatile graphical user interface provided by a Shiny App. This allows non-R users, such as experimentalists, to run many systemPipeR’s workflow designs, control, and visualization functionalities interactively without requiring knowledge of R. Most importantly, SPS has been designed as a general purpose framework for interacting with other R packages in an intuitive manner. Like most Shiny Apps, SPS can be used on both local computers as well as centralized server-based deployments that can be accessed remotely as a public web service for using SPR’s functionalities with community and/or private data. The framework can integrate many core packages from the R/Bioconductor ecosystem. Examples of SPS’ current functionalities include: (a) interactive creation of experimental designs and metadata using an easy to use tabular editor or file uploader; (b) visualization of workflow topologies combined with auto-generation of R Markdown preview for interactively designed workflows; (c) access to a wide range of data processing routines; (d) and an extendable set of visualization functionalities. Complex visual results can be managed on a ‘Canvas Workbench’ allowing users to organize and to compare plots in an efficient manner combined with a session snapshot feature to continue work at a later time. The present suite of pre-configured visualization examples include different methods to plot a count table. The modular design of SPR makes it easy to design custom functions without any knowledge of Shiny, as well as extending the environment in the future with contributions from the community.
5. Assembly of Next Generation Sequence Data
5.1 Reference-Assisted Genome Assembly
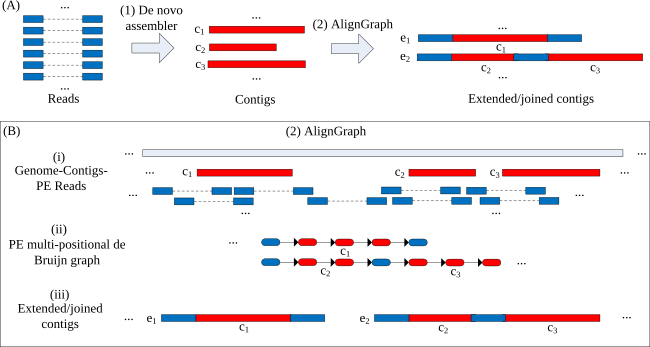
De novo assemblies of genomes remain one of the most challenging applications in next-generation sequencing. Usually, their results are incomplete and fragmented into hundreds of contigs. Repeats in genomes and sequencing errors are the main reasons for these complications. With the rapidly growing number of sequenced genomes, it is now feasible to improve assemblies by guiding them with genomes from related species. This project introduces AlignGraph, an algorithm for extending and joining de novo-assembled contigs or scaffolds guided by closely related reference genomes (Bao et al., 2014). It aligns paired-end (PE) reads and preassembled contigs or scaffolds to a close reference. From the obtained alignments, it builds a novel data structure, called the PE multipositional de Bruijn graph. The incorporated positional information from the alignments and PE reads allows us to extend the initial assemblies, while avoiding incorrect extensions and early terminations. In our performance tests, AlignGraph was able to substantially improve the contigs and scaffolds from several assemblers.
5.2 Reference-Assisted Transcriptome Assembly
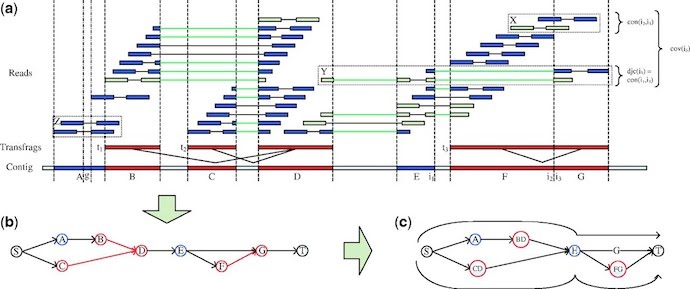
Owing to the complexity and often incomplete representation of transcripts in RNA-Seq libraries, the assembly of high-quality transcriptomes can be extremely challenging. To improve this, my group is developing algorithms for guiding these assemblies with genomic sequences of related organisms as well as reducing the complexity in NGS libraries. The software tools we have published for this purpose so far include SEED (Bao et al., 2011) and BRANCH (Bao et al., 2013). BRANCH is a reference assisted post-processing method for enhancing de novo transcriptome assemblies (Figure 8). It can be used in combination with most de novo transcriptome assembly software tools. The assembly improvements are achieved with help from partial or complete genomic sequence information. They can be obtained by sequencing and assembling a genomic DNA sample in addition to the RNA samples required for a transcriptome assembly project. This approach is practical because it requires only preliminary genome assembly results in form of contigs. Nowadays, the latter can be generated with very reasonable cost and time investments. In case the genome sequence of a closely related organism is available, one can skip the genome assembly step and use the related gene sequences instead. This type of reference assisted assembly approach provides many attractive opportunities for improving de novo NGS assemblies in the future by making use of the rapidly growing number of reference genome information available to us.
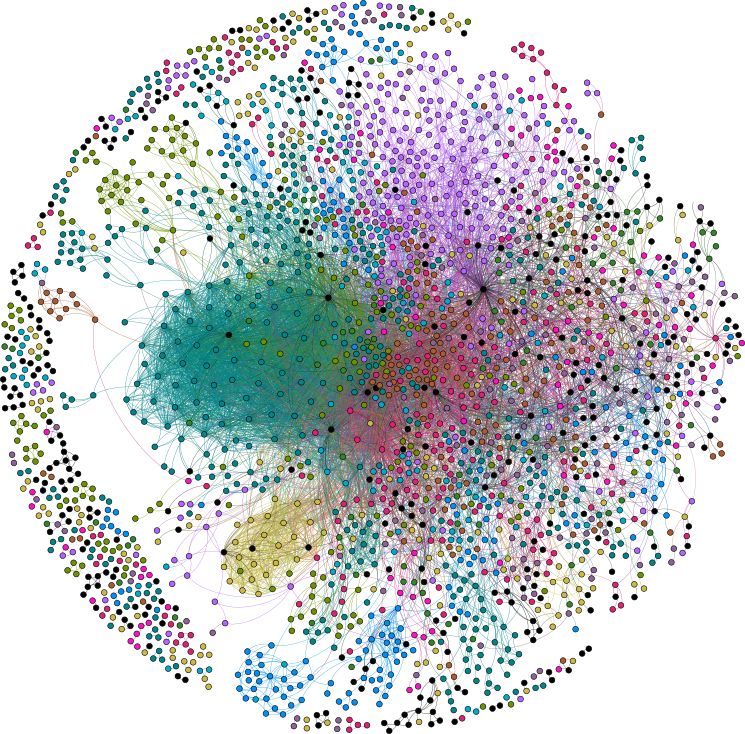
6. Modeling Gene Expression Networks from RNA-Seq and ChIP-Seq Data
As part of several collaborative research projects, my group has developed a variety of data analysis pipelines for profiling data from next generation sequencing projects (e.g. RNA-Seq and ChIP-Seq), microarray experiments and high-throughput small molecule screens. Most of the data analysis resources developed by these projects are described in the associated online manuals for next generation data analysis. Recent research publications of these projects include: Yang et al., 2013; Zou et al., 2013; Yadav et al., 2013; Yadav et al., 2011; Mustroph et al., 2009.
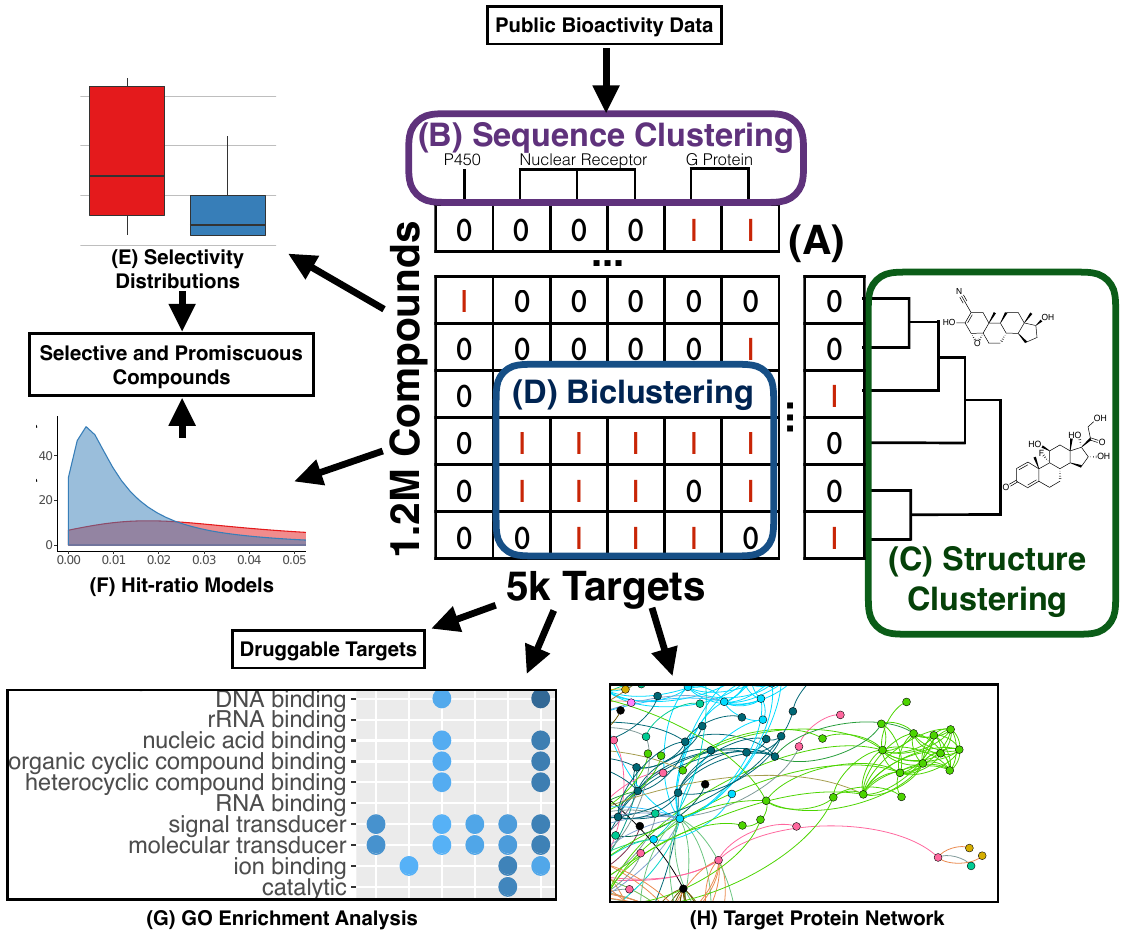
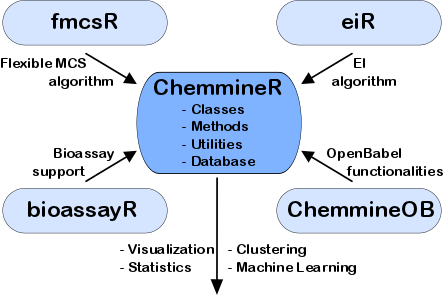
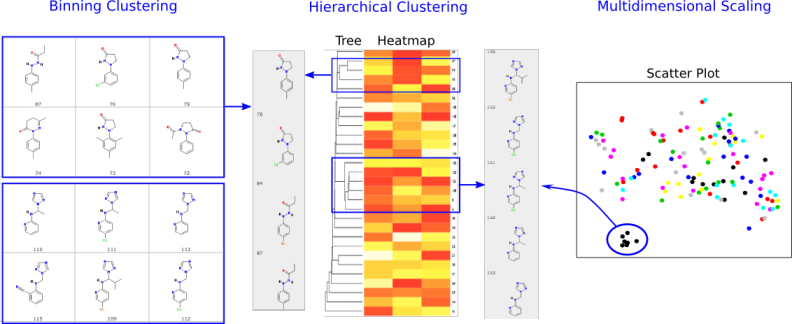
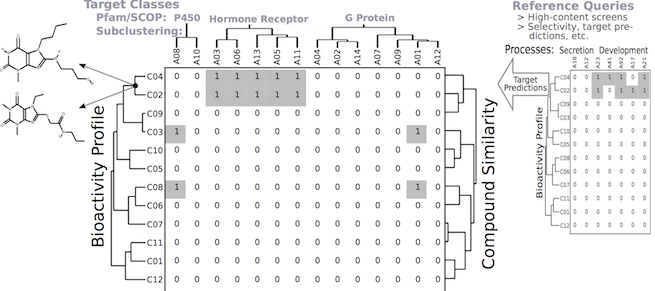
7. Software for Small Molecule Discovery and Chemical Genomics
Software tools for modeling the similarities among drug-like small molecules and high-throughput screening data are important for many applications in drug discovery and chemical genomics. In this area we are working on the development of the ChemmineR environment (Cao et al., 2008; Backman et al., 2011). This modular software infrastructure consists currently of five R/Bioconductor packages along with a user-friendly web interface, named ChemMine Tools that is intended for non-expert users (Figures 9-10). The integration of cheminformatic tools with the R programming environment has many advantages for small molecule discovery, such as easy access to a wide spectrum of statistical methods, machine learning algorithms and graphic utilities. Currently, the ChemmineR toolkit provides utilities for processing large numbers of molecules, physicochemical/structural property predictions, structural similarity searching, classification and clustering of compound libraries and screening results with a wide spectrum of algorithms. More recently, we have developed for this infrastructure the fmcsR algorithm which is the first mismatch tolerant maximum common substructure search tool in the field (Wang et al., 2013). In our comparisons with related structure similarity search tools, fmcsR showed the best virtual screening (VS) performance.
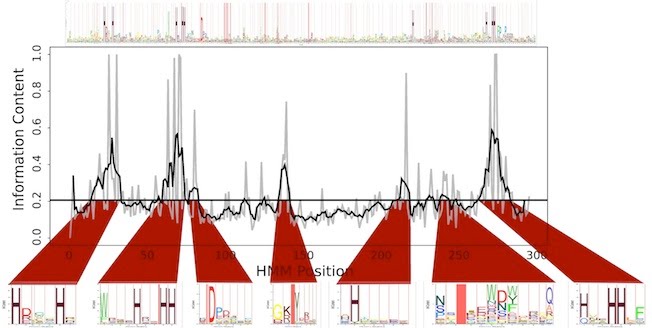
8. Function Prediction of Gene and Protein Sequences
Computational methods for characterizing the functions of protein sequences play an important role in the discovery of novel molecular, biochemical and regulatory activities. To facilitate this process, we have developed the sub-HMM algorithm that extends the application spectrum of profile HMMs to motif discovery and active site prediction in protein sequences (Horan et al. 2010). Its most interesting utility is the identification of the functionally relevant residues in proteins of known and unknown function (Figure 11). Additionally, sub-HMMs can be used for highly localized sequence similarity searches that focus on shorter conserved features rather than entire domains or global similarities. As part of this study we have predicted a comprehensive set of putative active sites for all protein families available in the Pfam database which has become a valuable knowledge resource for characterizing protein functions in the future.
References
- see Publication List