The following example performs hierarchical clustering on the rlog
transformed expression matrix subsetted by the DEGs identified in the above
differential expression analysis. It uses a Pearson correlation-based distance
measure and complete linkage for cluster joining.
library(pheatmap)
geneids <- unique(as.character(unlist(DEG_list[[1]])))
y <- assay(rlog(dds))[geneids, ]
png("results/heatmap1.png")
pheatmap(y, scale="row", clustering_distance_rows="correlation", clustering_distance_cols="correlation")
dev.off()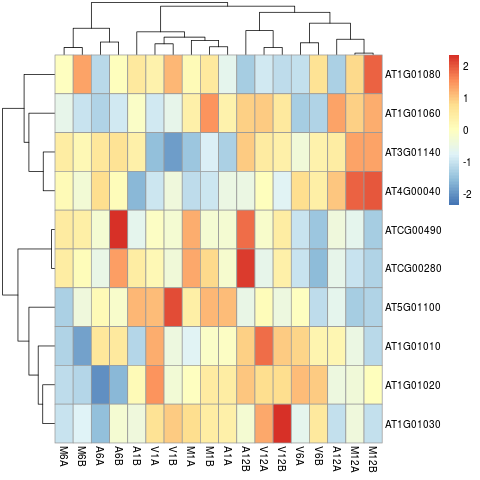
Figure 6: Heat Map with Hierarchical Clustering Dendrograms of DEGs