The genFeatures function generates a variety of feature types from
TxDb objects using utilities provided by the GenomicFeatures package.
Obtain feature types
The first step is the generation of the feature type ranges based on
annotations provided by a GFF file that can be transformed into a
TxDb object. This includes ranges for mRNAs, exons, introns, UTRs,
CDSs, miRNAs, rRNAs, tRNAs, promoter and intergenic regions. In addition, any
number of custom annotations can be included in this routine.
library(GenomicFeatures)
txdb <- makeTxDbFromGFF(file="data/tair10.gff", format="gff3", organism="Arabidopsis")
feat <- genFeatures(txdb, featuretype="all", reduce_ranges=TRUE, upstream=1000, downstream=0,
                    verbose=TRUE)
Count reads and plot results
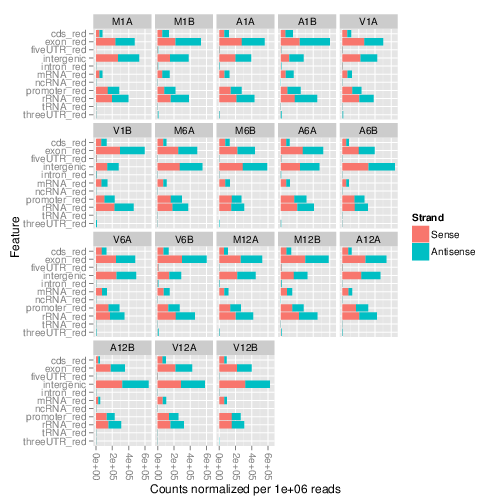
The featuretypeCounts function counts how many reads in short read
alignment files (BAM format) overlap with entire annotation categories. This
utility is useful for analyzing the distribution of the read mappings across
feature types, e.g. coding versus non-coding genes. By default the
read counts are reported for the sense and antisense strand of each feature
type separately. To minimize memory consumption, the BAM files are processed in
a stream using utilities from the Rsamtools and
GenomicAlignment packages. The counts can be reported for each read
length separately or as a single value for reads of any length. Subsequently,
the counting results can be plotted with the associated
plotfeaturetypeCounts function.
The following generates and plots feature counts for any read length.
library(ggplot2); library(grid)
fc <- featuretypeCounts(bfl=BamFileList(outpaths(args), yieldSize=50000), grl=feat,
                        singleEnd=TRUE, readlength=NULL, type="data.frame")
p <- plotfeaturetypeCounts(x=fc, graphicsfile="results/featureCounts.png", graphicsformat="png",
                           scales="fixed", anyreadlength=TRUE, scale_length_val=NULL)