- What is
lattice?- High-level graphics system
- Developed by Deepayan Sarkar
- Implements Trellis graphics system from S-Plus
- Simplifies high-level plotting tasks: arranging complex graphical features
- Syntax similar to R’s base graphics
- Documentation and Help
Open a list of all functions available in the lattice package
library(help=lattice) Accessing and changing global parameters:
?lattice.options
?trellis.device
Scatter Plot Sample
library(lattice)
p1 <- xyplot(1:8 ~ 1:8 | rep(LETTERS[1:4], each=2), as.table=TRUE)
plot(p1)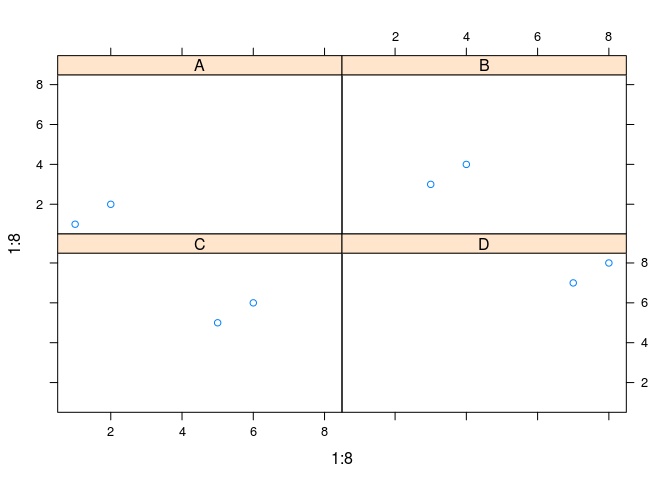
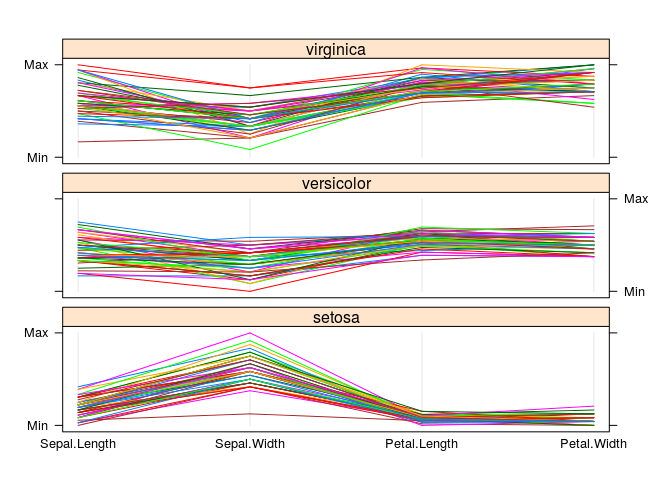
Line Plot Sample
library(lattice)
p2 <- parallelplot(~iris[1:4] | Species, iris, horizontal.axis = FALSE,
              layout = c(1, 3, 1))
plot(p2)