Obtain gene-to-GO mappings
The following shows how to obtain gene-to-GO mappings from biomaRt (here for A.
thaliana) and how to organize them for the downstream GO term
enrichment analysis. Alternatively, the gene-to-GO mappings can be
obtained for many organisms from Bioconductor’s *.db genome annotation
packages or GO annotation files provided by various genome databases.
For each annotation this relatively slow preprocessing step needs to be
performed only once. Subsequently, the preprocessed data can be loaded
with the load function as shown in the next subsection.
library("biomaRt")
listMarts() # To choose BioMart database
listMarts(host="plants.ensembl.org")
m <- useMart("plants_mart", host="plants.ensembl.org")
listDatasets(m)
m <- useMart("plants_mart", dataset="athaliana_eg_gene", host="plants.ensembl.org")
listAttributes(m) # Choose data types you want to download
go <- getBM(attributes=c("go_accession", "tair_locus", "go_namespace_1003"), mart=m)
go <- go[go[,3]!="",]; go[,3] <- as.character(go[,3])
go[go[,3]=="molecular_function", 3] <- "F"; go[go[,3]=="biological_process", 3] <- "P"; go[go[,3]=="cellular_component", 3] <- "C"
go[1:4,]
dir.create("./data/GO")
write.table(go, "data/GO/GOannotationsBiomart_mod.txt", quote=FALSE, row.names=FALSE, col.names=FALSE, sep="\t")
catdb <- makeCATdb(myfile="data/GO/GOannotationsBiomart_mod.txt", lib=NULL, org="", colno=c(1,2,3), idconv=NULL)
save(catdb, file="data/GO/catdb.RData")
Batch GO term enrichment analysis
Apply the enrichment analysis to the DEG sets obtained the above differential
expression analysis. Note, in the following example the FDR filter is set
here to an unreasonably high value, simply because of the small size of the toy
data set used in this vignette. Batch enrichment analysis of many gene sets is
performed with the function. When method=all, it returns all GO terms passing
the p-value cutoff specified under the cutoff arguments. When method=slim,
it returns only the GO terms specified under the myslimv argument. The given
example shows how a GO slim vector for a specific organism can be obtained from
BioMart.
library("biomaRt")
load("data/GO/catdb.RData")
DEG_list <- filterDEGs(degDF=edgeDF, filter=c(Fold=2, FDR=50), plot=FALSE)
up_down <- DEG_list$UporDown; names(up_down) <- paste(names(up_down), "_up_down", sep="")
up <- DEG_list$Up; names(up) <- paste(names(up), "_up", sep="")
down <- DEG_list$Down; names(down) <- paste(names(down), "_down", sep="")
DEGlist <- c(up_down, up, down)
DEGlist <- DEGlist[sapply(DEGlist, length) > 0]
BatchResult <- GOCluster_Report(catdb=catdb, setlist=DEGlist, method="all", id_type="gene", CLSZ=2, cutoff=0.9, gocats=c("MF", "BP", "CC"), recordSpecGO=NULL)
library("biomaRt")
m <- useMart("plants_mart", dataset="athaliana_eg_gene", host="plants.ensembl.org")
goslimvec <- as.character(getBM(attributes=c("goslim_goa_accession"), mart=m)[,1])
BatchResultslim <- GOCluster_Report(catdb=catdb, setlist=DEGlist, method="slim", id_type="gene", myslimv=goslimvec, CLSZ=10, cutoff=0.01, gocats=c("MF", "BP", "CC"), recordSpecGO=NULL)
Plot batch GO term results
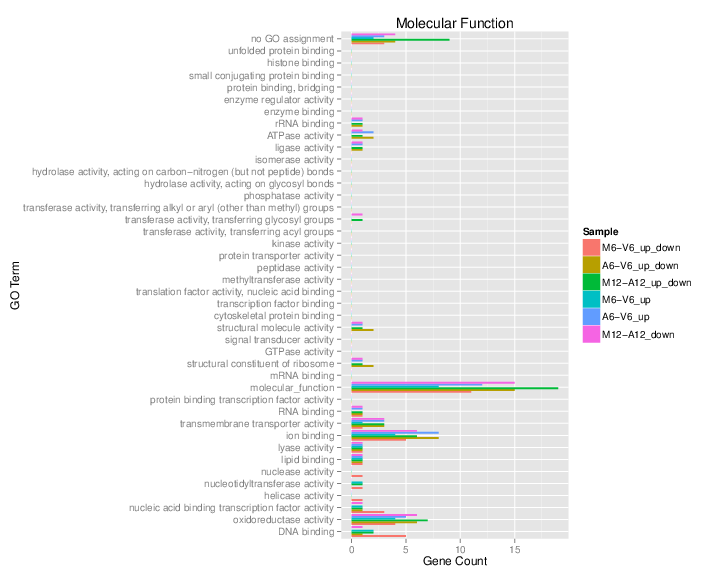
The data.frame generated by GOCluster can be plotted with the goBarplot function. Because of the
variable size of the sample sets, it may not always be desirable to show
the results from different DEG sets in the same bar plot. Plotting
single sample sets is achieved by subsetting the input data frame as
shown in the first line of the following example.
gos <- BatchResultslim[grep("M6-V6_up_down", BatchResultslim$CLID), ]
gos <- BatchResultslim
png("./results/GOslimbarplotMF.png", height=12, width=12, units="in", res=72)
goBarplot(gos, gocat="MF")
dev.off()
goBarplot(gos, gocat="BP")
goBarplot(gos, gocat="CC")