Toggle navigation
Data Analysis Tutorials
Search
Github Repo
Resources
CRAN
Bioconductor
GitHub
Jekyll
Girke Lab
Jekyll Doc Theme
Feedback
Manuals
Under Construction!
Overview
Introduction
Class teaching
Introduction to R
1. Overview
2. R Package Repositories
3. Installation of R and Add-on Packages
4. Getting Around
5. Basic Syntax
6. Data Types
7. Data objects
8. Graphics example
9. Session Info
ChemmineR
1. Introduction
2. Getting Started
3. OpenBabel Functions
4. Overview of Classes and Functions
5. Import of Compounds
6. Export of Compounds
7. Format Interconversions
8. Splitting SD Files
9. Streaming Through Large SD Files
10. Storing Compounds in an SQL Database
11. Working with SDF/SDFset Classes
12. Molecular Property Functions (Physicochemical Descriptors)
13. Bond Matrices
14. Charges and Missing Hydrogens
15. Ring Perception and Aromaticity Assignment
16. Rendering Chemical Structure Images
17. Similarity Comparisons and Searching
18. Clustering
19. Searching PubChem
20. ChemMine Tools R Interface
21. Version Information
22. Funding
23. References
bioassayR
1. Introduction
2. Getting Started
3. Examples
4. Building PubChem BioAssay Database
5. Version Information
6. Funding
7. References
systemPipeR
1. Introduction
2. Getting Started
3. Workflow overview
4. Workflow templates
5. Version information
6. References
Internal notes
Administration of site
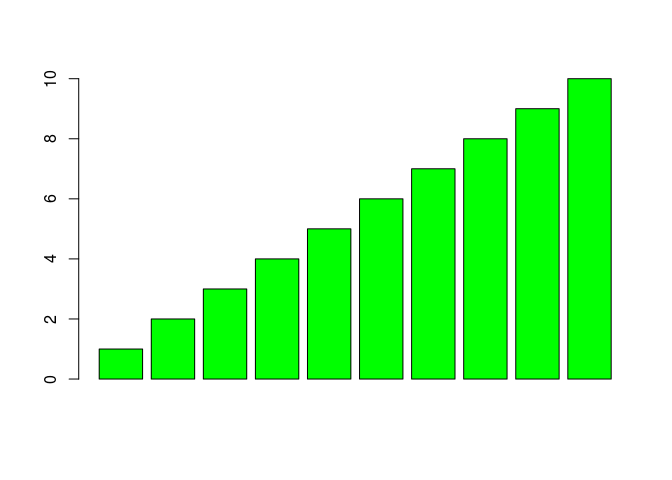
Graphics example
Plotting example
barplot
(
1
:
10
,
col
=
"green"
)