R Graphics Device
A new plotting function for compound structures has been added to the
package recently. This function uses the native R graphics device for
generating compound depictions. At this point this function is still in
an experimental developmental stage but should become stable soon.
If you have ChemmineOB available you can use the regenCoords
option to have OpenBabel regenerate the coordinates for the compound.
This can sometimes produce better looking plots.
Plot compound Structures with R’s graphics device:
 data(sdfsample)
 sdfset <- sdfsample
 plot(sdfset[1:4], regenCoords=TRUE,print=FALSE) # 'print=TRUE' returns SDF summaries
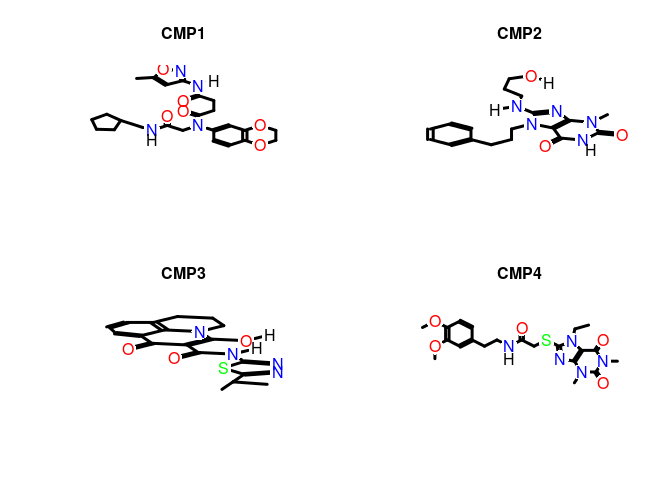
Customized plots:
 plot(sdfset[1:4], griddim=c(2,2), print_cid=letters[1:4], print=FALSE,
		noHbonds=FALSE)
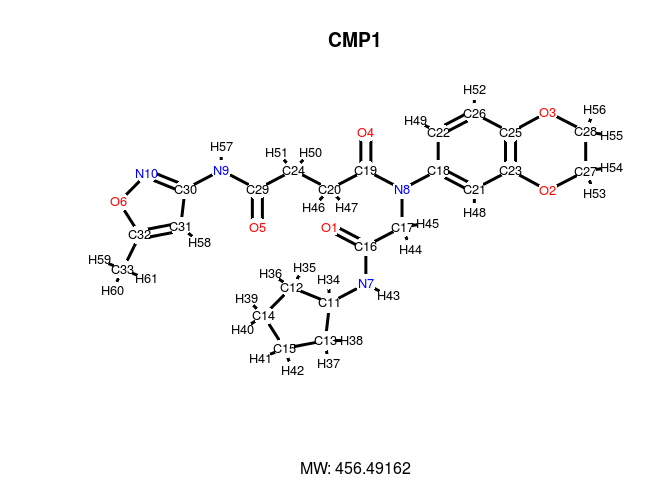
In the following plot, the atom block position numbers in the SDF are
printed next to the atom symbols (atomnum = TRUE). For
more details, consult help documentation with
?plotStruc or ?plot.
 plot(sdfset["CMP1"], atomnum = TRUE, noHbonds=F , no_print_atoms = "",
	  	atomcex=0.8, sub=paste("MW:", MW(sdfsample["CMP1"])), print=FALSE)
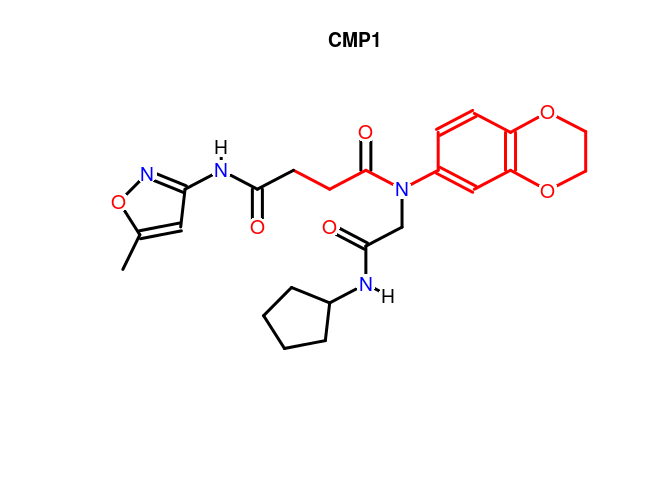
Substructure highlighting by atom numbers:
plot(sdfset[1], print=FALSE, colbonds=c(22,26,25,3,28,27,2,23,21,18,8,19,20,24))
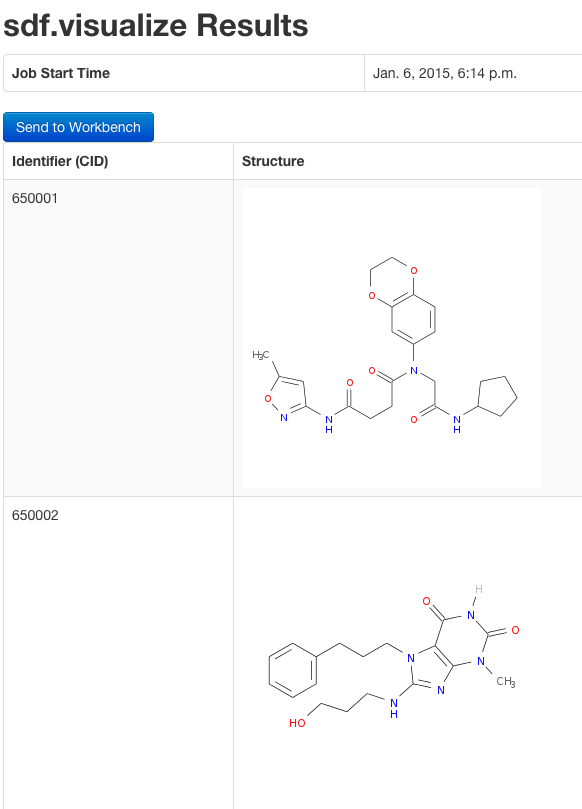
Alternatively, one can visualize compound structures with a standard web
browser using the online ChemMine Tools service.
Plot structures using web service ChemMine Tools:
sdf.visualize(sdfset[1:4])