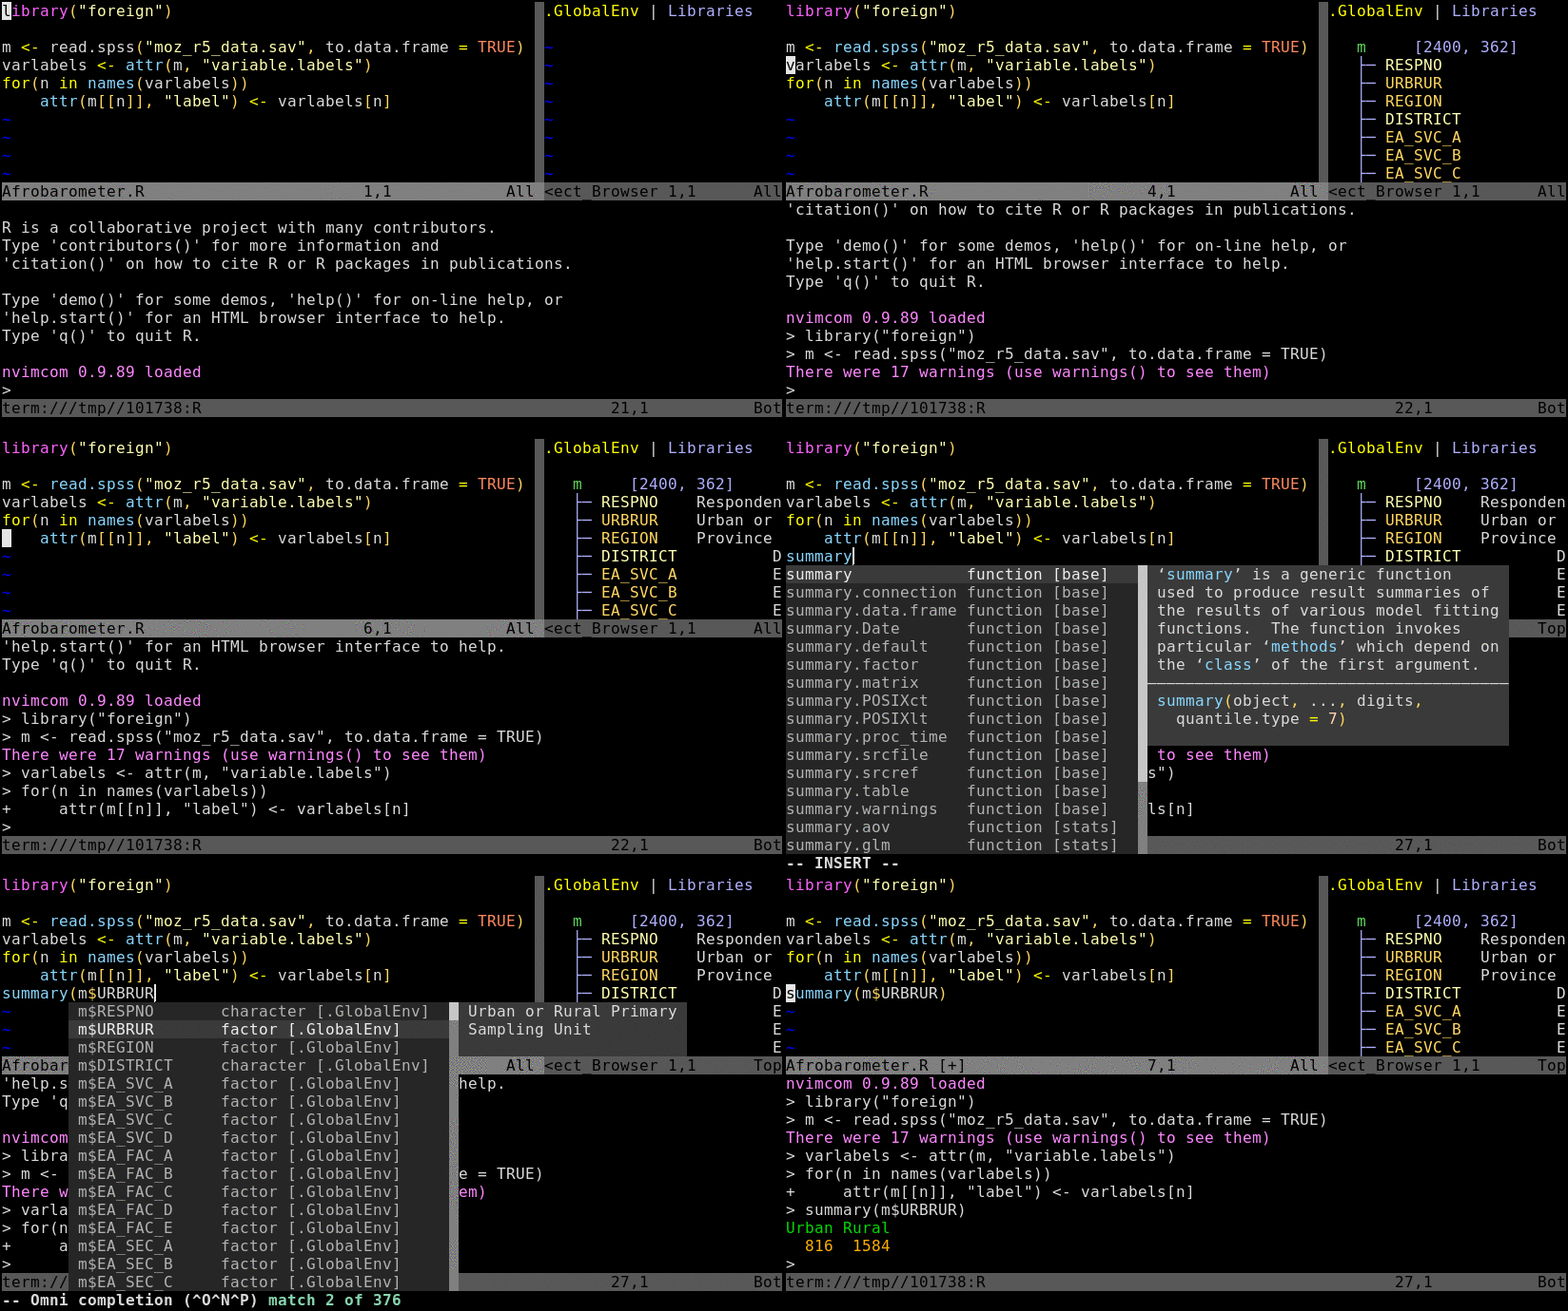
To try out the following instructions, users want to log into their HPCC account via ssh, and then preferentially connect to a node by initializing an interactive srun session. The latter mimics the best practices for a real workflow but is not necessary for this basic exercise. If Nvim-R is not installed in a user’s account yet, then configure it with the Install_Nvim-R_Tmux command as outlined here.
srun --x11 --partition=short --mem=2gb --cpus-per-task 4 --ntasks 1 --time 1:00:00 --pty bash -l
- Under
--partition it is important to assign the name of a partition a user has access to
- Most users have access to:
short, batch, intel and highmem
- Users of labs owning computer nodes also can access:
<pi_name>lab
- For more details on argument settings for
srun, see here
Download R_for_HPC_demo.R or nvimr_demo.R file to you HPCC account as follows.
wget https://raw.githubusercontent.com/tgirke/GEN242/main/static/custom/slides/R_for_HPC/demo_files/R_for_HPC_demo.R
wget https://raw.githubusercontent.com/tgirke/GEN242/main/static/custom/slides/R_for_HPC/demo_files/nvimr_demo.R
[ Scroll down to continue ]
Open R_for_HPC_demo.R or nvim_demo.R with nvim. The content of R_for_HPC_demo.R file is shown in the following code block. Next, initialize a Nvim-connected R session with \rf, and then execute the code by pressing the space bar on your keyboard.
library(tidyverse)
write_tsv(iris, "iris.txt") # Creates sample file
read_tsv("iris.txt") %>% # Import with read_tbv from readr package
    as_tibble() %>%
    group_by(Species) %>%
    summarize_all(mean) %>%
    reshape2::melt(id.vars=c("Species"), variable.name = "Samples", value.name="Values") %>%
    ggplot(aes(Samples, Values, fill = Species)) +
    geom_bar(position="dodge", stat="identity")
[ Scroll down to continue ]
If X11 is enabled in a user session then the above code will generate the following bar plot in a separate graphics window.


